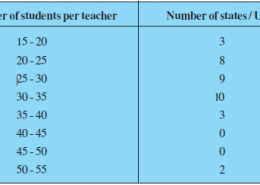
Find the mode and mean of this data. Interpret the two measures.
NCERT Class 10 Maths Chapter 14
Page No. 276
Exercise 14.2
Question No. 4
The following distribution gives the state-wise teacher-student ratio in higher secondary schools of India.
Share

It can be observed that the maximum class frequency is 10, belonging to 30 – 35.
Therefore, Modal class = 30 – 35
Class size (h) = 5
Lower limit (l) of modal class = 30
Frequency (f₁) of modal class = 10
Frequency (f₀) of class preceding the modal class = 9
Frequency (f₂) of class succeeding the modal class 3
Mode = l + ((f₁ – f₀)/(2f₁ – f₀ – f₂)) × h = 30 + ((10 – 9)/(2 × 10 – 9 – 3)) × 5 = 30 + 1/8 × 5 = 30 + 0.625 = 30.625
It represent that most of the states/U.T have a teacher-student ratio as 30.6.
To find the class marks, the following relation is used.
xᵢ = (Upper Limit + Lower Limit)/2
Taking 32.5 as assumed mean (a), dᵢ, uᵢ and fᵢuᵢ are calculated as follows.
From the table, we obtain
∑fᵢ = 35, ∑fᵢuᵢ = -23, a = 32.5 and h = 5
mean (X̄) = a + (∑fᵢuᵢ / ∑fᵢ)h = 32.5 + (-23/35) × 5 = 32.5 – 23/7 = 32.5 – 3.28 = 29.22
Therefore, mean of the data is 29.2.
It represents that on an average, teacher-student ration was 29.2