
NCERT Solutions for Class 6 Maths Chapter 9
Important NCERT Questions
Data Handling Chapter 9 Exercise 9.3
NCERT Books for Session 2022-2023
CBSE Board
Questions No: 1
Lost your password? Please enter your email address. You will receive a link and will create a new password via email.
NCERT Solutions for Class 6 Maths Chapter 9
Important NCERT Questions
Data Handling Chapter 9 Exercise 9.3
NCERT Books for Session 2022-2023
CBSE Board
Questions No: 1
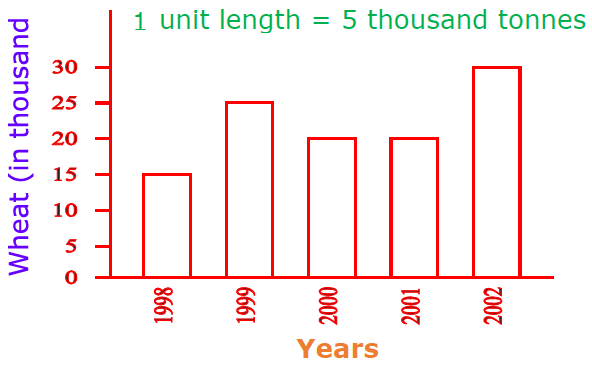
(a) In 2002, production of wheat was maximum.
(b) In 1998, production of wheat was minimum.
https://www.tiwariacademy.com/ncert-solutions/class-6/maths/chapter-9/