Find the mode of the data.
NCERT MATHEMATICS Class 10 chapter 14
Page No. 276
Exercise 14.1
Question No. 6
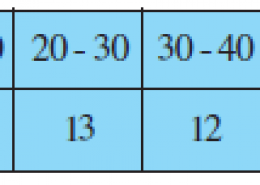
A student noted the number of cars passing through a spot on a road for 100 periods each of 3 minutes and summarised it in the table given below.
Share

From the given data, it can be observed that the maximum class frequency is 20, belonging to 4000 – 5000 class interval.
Therefore, modal class = 40 – 50
Lower limit () of modal class = 40
Frequency (f₁) of modal class = 20
Frequency (f₀) of class preceding modal class = 12
Frequency (f₂) of class succeeding modal class = 11
Class size (h) = 10
Mode = l + ((f₁ – f₀)/(2f₁ – f₀ – f₂)) × h = 40 + ((20 – 12)/(2 × 20 – 12 – 11)) × 10 = 40 + 8/17 × 10 = 40 + 4.7 = 44.7
Therefore, mode of the this data is 44.7 cars.