
Plotting points on a plane involves representing each point as an ordered pair of numbers (x, y) and choosing suitable units of distance on the axes to determine the scale of the graph. We label the axes accordingly and plot each point as a dot on the graph, allowing us to visualize the data and analyze any patterns or trends that may be present.
NCERT Class 9 Mathematics Chapter 3
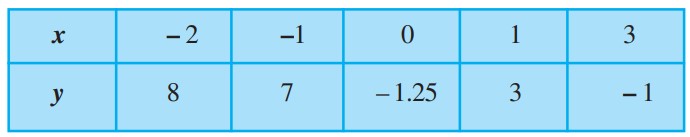
Page No. 65
Exercise 3.3
Question No. 2
Here is the Video Explanation for this question 😁