NCERT Solutions for Class 6 Maths Chapter 9
Important NCERT Questions
Data Handling Chapter 9 Exercise 9.3
NCERT Books for Session 2022-2023
CBSE Board
Questions No: 2
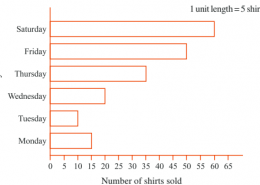
Observe this bar graph which is showing the sale of shirts in a readymade shop from Monday to Saturday. Now answer the following questions: (a) What information does the above bar graph give? (b) What is the scale chosen on the horizontal line representing number of shirts? (c) On which day were the maximum number of shirts sold? How many shirts were sold on that day? (d) On which day were the minimum number of shirts sold? (e) How many shirts were sold on Thursday?
Share

(a) The bar graph shows the sale of shirt in a readymade shop from Monday to Saturday.
(b) 1 unit = 5 shirts
(c) On Saturday, maximum number of shirts, 60 shirts were sold.
(d) On Tuesday, minimum number of shirts were sold.
(e) On Tuesday, 35 shirts were sold.
https://www.tiwariacademy.com/ncert-solutions/class-6/maths/chapter-9/