
NCERT Solutions for Class 8 Mathematics Chapter 15
Important NCERT Questions
Introduction to Graphs Chapter 8 Exercise 15.1
NCERT Books for Session 2022-2023
CBSE Board
Questions No: 3
Lost your password? Please enter your email address. You will receive a link and will create a new password via email.
NCERT Solutions for Class 8 Mathematics Chapter 15
Important NCERT Questions
Introduction to Graphs Chapter 8 Exercise 15.1
NCERT Books for Session 2022-2023
CBSE Board
Questions No: 3
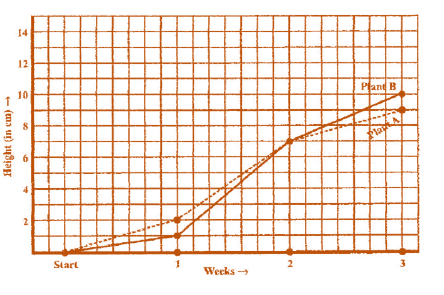
(a) (i) The plant A was 7 cm high after 2 weeks and
(ii) after 3 weeks it was 9 cm high.
(b) (i) Plant B was also 7 cm high after 2 weeks and
(ii) after 3 weeks it was 10 cm high.
(c) Plant A grew = 9 cm – 7 cm = 2 cm during 3ʳᵈweek.
(d) Plant B grew during end of the 2 ⁿᵈ week to the end of the 3ʳᵈ week = 10 cm – 7 cm = 3 cm.
(e) Plant A grew the highest during second week.
(f) Plant B grew the least during first week.
(g) At the end of the second week, plant A and B were of the same height.
Class 8 Maths Chapter 11 Exercise 15.1 Solution in Video
for more answers vist to:
https://www.tiwariacademy.com/ncert-solutions/class-8/maths/chapter-15/