Sign Up


Have an account? Sign In Now

Sign In


Forgot Password?

Don't have account, Sign Up Here

Forgot Password

Lost your password? Please enter your email address. You will receive a link and will create a new password via email.


Have an account? Sign In Now

You must login to ask question.


Forgot Password?

Need An Account, Sign Up Here
Sign InSign Up

Discussion Forum

Discussion Forum Logo Discussion Forum Logo

Discussion Forum Navigation

  • NCERT Solutions
  • MCQ Online Test
  • हिंदी मीडियम
Search
Ask A Question

Mobile menu

Close
Ask a Question
  • NCERT Solutions
  • MCQ Online Test
  • हिंदी मीडियम
Home/ Questions/Q 209500
Next
Answered
Mridul Gupta
  • 2
Mridul Gupta
Asked: February 28, 20232023-02-28T09:31:18+00:00 2023-02-28T09:31:18+00:00In: Class 10 Maths

During the medical check-up of 35 students of a class, their weights were recorded as follows:

  • 2
During the medical check-up of 35 students of a class, their weights were recorded as follows:

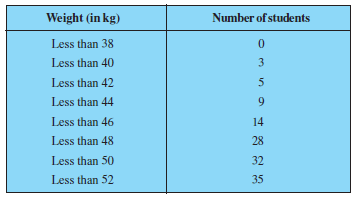
Draw a less than type ogive for the given data. Hence obtain the median weight from the graph and verify the result by using the formula.
NCERT Math’s class 10 chapter 14
Page No. 293
Exercise 14.4
Question 2

chapter 14class 10ncert
  • 1 1 Answer
  • 174 Views
  • 2 Followers
  • 2
Answer
Share
  • Facebook

    1 Answer

    • Voted
    • Oldest
    • Recent
    1. Best Answer
      Lalit gandhi
      2023-02-28T09:40:51+00:00Added an answer on February 28, 2023 at 9:40 am
      During the medical check-up of 35 students of a class, their weights were recorded as follows:

      It can be observed that the difference between two consecutive upper class limits is 2. The class marks with their respective frequencies are obtained as below.

      Weight (in kg) Less than38 38-40 40-42 42-44 44 46 46-48 48-50 50-52 Total(n)
      Frequency (f) 0 3-0=3 5-3=2 9-5=4 14-9=5 28-14=14 32-28=4 35-32=3 35
      Cumulative
      frequency 0 3 5 9 14 28 32 35

      The cumulative frequency just greater than n/2 (i.e. 35/2 = 17.5) is 28, belonging to class intervals 46- 48.
      Median class = 46 – 48
      lower class limit (l) of median class = 46
      Cumulative frequency (cf) of class preceding median class = 14
      Class size (h) = 2
      Median = l + ((n/2 – cf)/f) × h = 46 + ((17.5 – 14)/14) × 2 = 46 + 0.5 = 46.5
      Therefore, median of this data is 46.5.
      Hence, the value of median is verified.

      • 2
      • Reply
      • Share
        Share
        • Share on Facebook
        • Share on Twitter
        • Share on LinkedIn
        • Share on WhatsApp
    Leave an answer

    Leave an answer
    Cancel reply

    Browse

    Sidebar

    Ask A Question

    Subscribe

    • Popular
    • Answers
    • Mrinal Garg

      Which is the best website providing NCERT Solutions?

      • 116 Answers
    • Richa

      NCERT Books

      • 31 Answers
    • manishq1

      Where can I get NCERT books in PDF format?

      • 26 Answers
    • Richa

      NIOS

      • 15 Answers
    • Richa

      NCERT Solutions

      • 12 Answers
    • Piyush365
      Piyush365 added an answer Dr. Dolittle was a kind-hearted physician who initially treated human… May 14, 2025 at 7:01 am
    • Piyush365
      Piyush365 added an answer Dr. Dolittle initially worked as a medical doctor, treating human… May 14, 2025 at 7:01 am
    • Piyush365
      Piyush365 added an answer People stopped visiting Dr. Dolittle for medical help because his… May 14, 2025 at 7:01 am
    • Piyush365
      Piyush365 added an answer Dr. Dolittle’s house was home to a wide variety of… May 14, 2025 at 7:01 am
    • Vansh
      Vansh added an answer Very nice May 14, 2025 at 4:21 am

    Explore

    • Home
    • Questions

    © 2025 Tiwari Academy. All Rights Reserved