
NCERT Solutions for Class 8 Mathematics Chapter 15
Important NCERT Questions
Introduction to Graphs Chapter 8 Exercise 15.1
NCERT Books for Session 2022-2023
CBSE Board
Questions No: 7
Lost your password? Please enter your email address. You will receive a link and will create a new password via email.
NCERT Solutions for Class 8 Mathematics Chapter 15
Important NCERT Questions
Introduction to Graphs Chapter 8 Exercise 15.1
NCERT Books for Session 2022-2023
CBSE Board
Questions No: 7
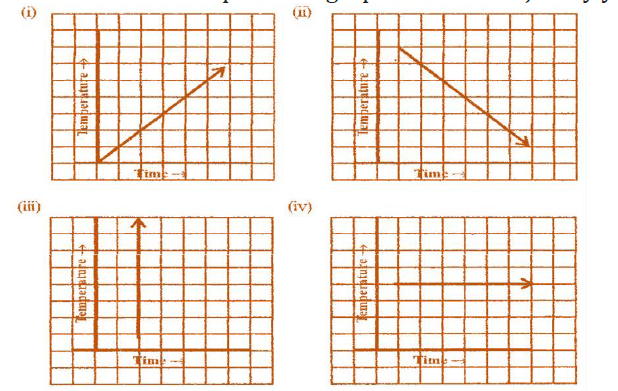
(i) It is showing the increase in temperature.
(ii) It is showing the decrease in temperature.
(iii) The graph figure (iii) is not possible since temperature is increasing very rapidly which is not possible.
(iv) It is showing constant temperature.
Class 8 Maths Chapter 11 Exercise 15.1 Solution in Video
for more answers vist to:
https://www.tiwariacademy.com/ncert-solutions/class-8/maths/chapter-15/