Sign Up


Have an account? Sign In Now

Sign In


Forgot Password?

Don't have account, Sign Up Here

Forgot Password

Lost your password? Please enter your email address. You will receive a link and will create a new password via email.


Have an account? Sign In Now

You must login to ask question.


Forgot Password?

Need An Account, Sign Up Here
Sign InSign Up

Discussion Forum

Discussion Forum Logo Discussion Forum Logo

Discussion Forum Navigation

  • NCERT Solutions
  • MCQ Online Test
  • हिंदी मीडियम
Search
Ask A Question

Mobile menu

Close
Ask a Question
  • NCERT Solutions
  • MCQ Online Test
  • हिंदी मीडियम
Home/introduction to graphs/Page 2

Discussion Forum Latest Questions

Evaraj
Evaraj
Asked: March 14, 2021In: Class 8 Maths

A courier-person cycles from a town to a neighbouring suburban area to deliver a parcel to a merchant. His distance from the town at different times is shown by the following graph. (a) What is the scale taken for the time axis? (b) How much time did the person take for the travel? (c) How far is the place of the merchant from the town? (d) Did the person stop on his way? Explain. (e) During which period did he ride fastest?

A courier-person cycles from a town to a neighbouring suburban area to deliver a parcel to a merchant. His distance from the town at different times is shown by the following graph. (a) What is the scale taken for the time axis? (b) How much time did the person take for the travel? (c) How far is the place of the merchant from the town? (d) Did the person stop on his way? Explain. (e) During which period did he ride fastest?

NCERT Solutions for Class 8 Mathematics Chapter 15 Important NCERT Questions Introduction to Graphs Chapter 8 Exercise 15.1 NCERT Books for Session 2022-2023 CBSE Board Questions No: 6

2020-2021cbsechapter 15class8introduction to graphsmathematicsncert
  • 1 1 Answer
  • 164 Views
  • 5 Votes
Answer
Evaraj
Evaraj
Asked: March 14, 2021In: Class 8 Maths

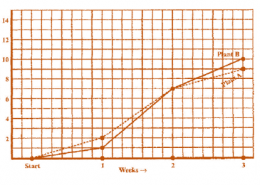
For an experiment in Botany, two different plants, plant A and plant B were grown under similar laboratory conditions. Their heights were measured at the end of each week for 3 weeks. The results are shown by the following graph. (a) How high was Plant A after (i) 2 weeks (ii) 3 weeks? (b) How high was Plant B after (i) 2 weeks (ii) 3 weeks? (c) How much did Plant A grow during the 3rd week? (d) How much did Plant B grow from the end of the 2nd week to the end of the 3rd week? (e) During which week did Plant A grow most? (f) During which week did Plant B grow least? (g) Were the two plants of the same height during any week shown here? Specify.

For an experiment in Botany, two different plants, plant A and plant B were grown under similar laboratory conditions. Their heights were measured at the end of each week for 3 weeks. The results are shown by the following graph. (a) How high was Plant A after (i) 2 weeks (ii) 3 weeks? (b) How high was Plant B after (i) 2 weeks (ii) 3 weeks? (c) How much did Plant A grow during the 3rd week? (d) How much did Plant B grow from the end of the 2nd week to the end of the 3rd week? (e) During which week did Plant A grow most? (f) During which week did Plant B grow least? (g) Were the two plants of the same height during any week shown here? Specify.

NCERT Solutions for Class 8 Mathematics Chapter 15 Important NCERT Questions Introduction to Graphs Chapter 8 Exercise 15.1 NCERT Books for Session 2022-2023 CBSE Board Questions No: 3

2020-2021cbsechapter 15class8introduction to graphsmathematicsncert
  • 1 1 Answer
  • 108 Views
  • 5 Votes
Answer
Evaraj
Evaraj
Asked: March 14, 2021In: Class 8 Maths

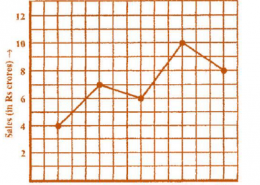
The following line graph shows the yearly sales figures for a manufacturing company. (a) What were the sales in (i) 2002 (ii) 2006? (b) What were the sales in (i) 2003 (ii) 2005? (c) Compute the difference between the sales in 2002 and 2006. (d) In which year was there the greatest difference between the sales as compared to its previous year?

The following line graph shows the yearly sales figures for a manufacturing company.  (a) What were the sales in (i) 2002 (ii) 2006? (b) What were the sales in (i) 2003 (ii) 2005?  (c) Compute the difference between the sales in 2002 and 2006. (d) In which year was there the greatest difference between the sales as compared to its previous year?

NCERT Solutions for Class 8 Mathematics Chapter 15 Important NCERT Questions Introduction to Graphs Chapter 8 Exercise 15.1 NCERT Books for Session 2022-2023 CBSE Board Questions No: 2

2020-2021cbsechapter 15class8introduction to graphsmathematicsncert
  • 1 1 Answer
  • 105 Views
  • 6 Votes
Answer
Evaraj
Evaraj
Asked: March 14, 2021In: Class 8 Maths

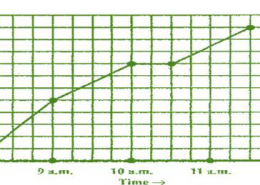
The following graph shows the temperature of a patient in a hospital, recorded every hour: (a) What was the patient’s temperature at 1 p.m.? (b) When was the patient’s temperature 38.5° C? (c) The patient’s temperature was the same two times during the period given. What were these two times? (d) What was the temperature at 1.30 p.m.? How did you arrive at your answer? (e) During which periods did the patients’ temperature showed an upward trend?

NCERT Solutions for Class 8 Mathematics Chapter 15 Important NCERT Questions Introduction to Graphs Chapter 8 Exercise 15.1 NCERT Books for Session 2022-2023 CBSE Board Questions No: 1
2020-2021cbsechapter 15class8introduction to graphsmathematicsncert
  • 1 1 Answer
  • 149 Views
  • 6 Votes
Answer
1 2

Sidebar

Ask A Question

Subscribe

  • Popular
  • Answers
  • Mrinal Garg

    Which is the best website providing NCERT Solutions?

    • 116 Answers
  • Richa

    NCERT Books

    • 31 Answers
  • manishq1

    Where can I get NCERT books in PDF format?

    • 26 Answers
  • Richa

    NIOS

    • 15 Answers
  • Richa

    NCERT Solutions

    • 12 Answers
  • Ayushree
    Ayushree added an answer One of the most memorable places I’ve visited is the… May 10, 2025 at 11:05 am
  • Ayushree
    Ayushree added an answer My visit to the Golden Temple was made special by… May 10, 2025 at 11:05 am
  • Ayushree
    Ayushree added an answer At the Golden Temple, all my senses were awakened. I… May 10, 2025 at 11:05 am
  • Ayushree
    Ayushree added an answer Whenever I think about my visit to the Golden Temple,… May 10, 2025 at 11:05 am
  • Ayushree
    Ayushree added an answer If I couldn’t see or hear during my visit to… May 10, 2025 at 11:05 am

Explore

  • Home
  • Questions

© 2025 Tiwari Academy. All Rights Reserved