NCERT Solutions for Class 8 Mathematics Chapter 15
Important NCERT Questions
Introduction to Graphs Chapter 8 Exercise 15.1
NCERT Books for Session 2022-2023
CBSE Board
Questions No: 2
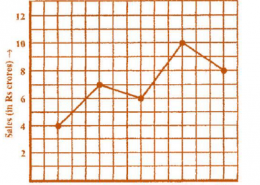
The following line graph shows the yearly sales figures for a manufacturing company. (a) What were the sales in (i) 2002 (ii) 2006? (b) What were the sales in (i) 2003 (ii) 2005? (c) Compute the difference between the sales in 2002 and 2006. (d) In which year was there the greatest difference between the sales as compared to its previous year?
Share

(a) The sales in:
(i) 2002 was ₹ 4 crores and (ii) 2006 was ₹ 8 crores.
(b) The sales in:
(i) 2003 was ₹ 7 crores and (ii) 2005 was ₹10 crores.
(c) The difference of sales in 2002 and 2006 = ₹8 crores – ₹4 crores = ₹ 4 crores
(d) In the year 2005, there was the greatest difference between the sales as
compared to its previous year, which is (₹10 crores – ₹ 6 crores) = ₹4 crores.
Class 8 Maths Chapter 11 Exercise 15.1 Solution in Video
for more answers vist to:
https://www.tiwariacademy.com/ncert-solutions/class-8/maths/chapter-15/